relevent/ marketing ideas

You’ll find tons of metrics and insights reported across all the event marketing platforms you use. They can help paint an overall picture of your event’s success, but some are MUCH more telling than others when it comes to event evaluation.
Navigating this deluge of data at every stage of your event marketing campaign can be challenging. In this article, we’ll explain how to measure the success of an event using just a few powerful key performance indicators.
Early-bird period: scan your social media engagement
Pre-event: determine the number of repeat attendees
Onsite: track your rates of attrition and check-in
Post-event: measure your Net Promoter Score
Let’s dive deeper into our favourite methods of event evaluation.
During the early-bird registration period, it could be difficult to gauge how your audience is feeling about your event. Many tend to delay their abstract submissions to the last minute, making it quite stressful for event planners trying to get a sense of this year’s potential success. Sure, your event is still months away, but there are ways you can structure your campaign to ensure that your meeting stays top-of-mind.
Make sure to keep anticipation levels high by steadily revealing keynote speakers, releasing great content that directly involves your influencers and stakeholders, and posting regularly about your new event features and highlights.
As you do this, you’ll be able to monitor one of the best event metrics out there: social media engagement. True engagement should not be confused with vanity metrics. While impression numbers are often very impressive-looking, they don’t account for actual interaction with your brand and content. In many cases, they simply indicate that someone scrolled by your post in their feed.
Takeaway: clicks, likes, reshares, and conversions can give you a snapshot of what people are excited about during this crucial time.
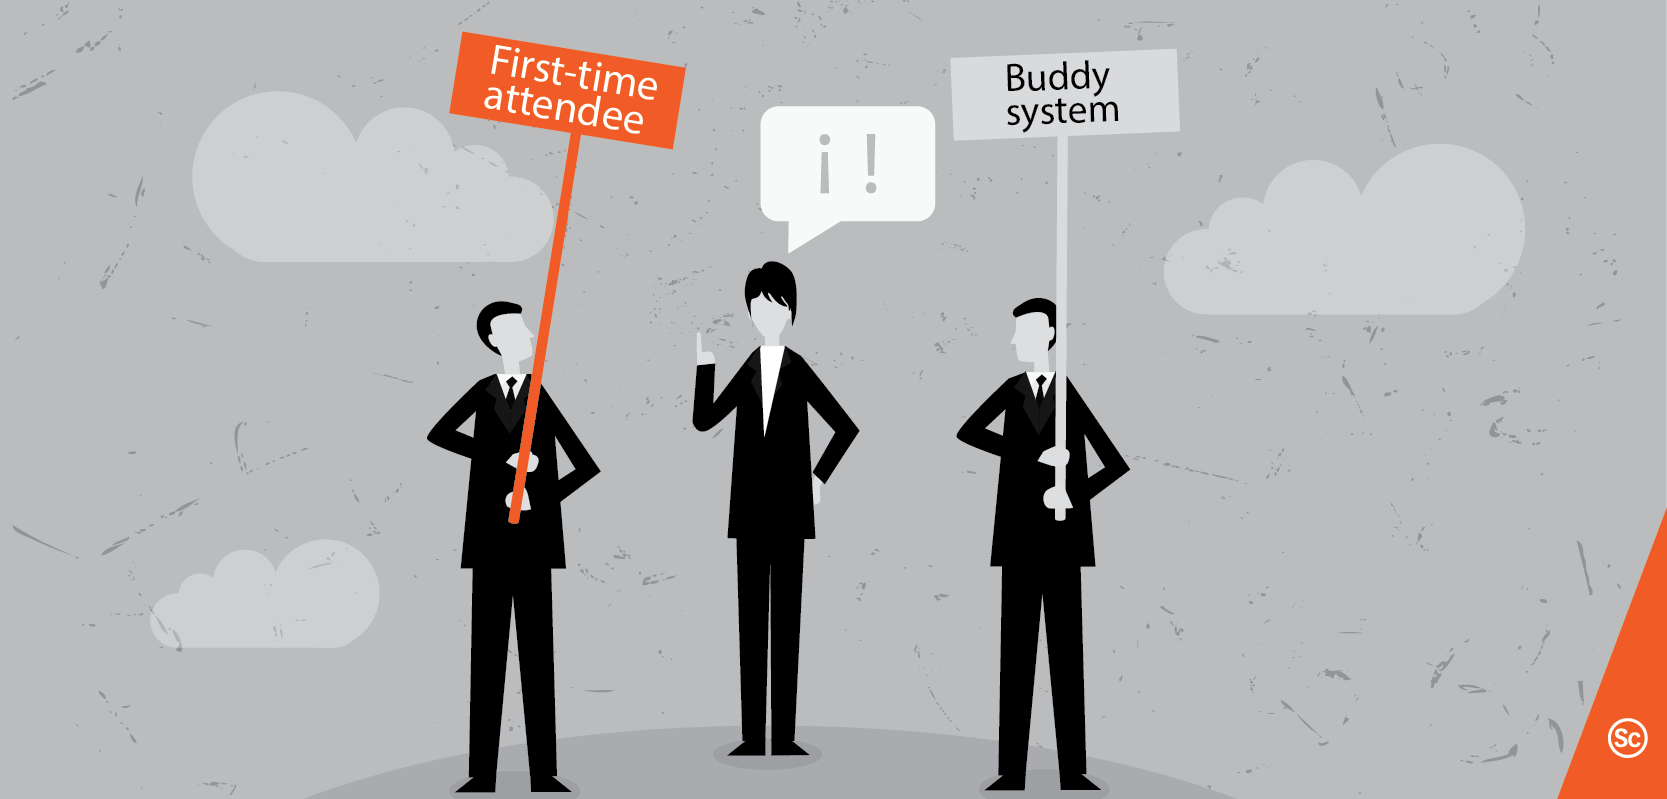
You’ll have most of your registrations ironed out as the regular registration period comes to an end. Your ultimate goal is to maximize the number of butts in seats, of course. But a more interesting metric for event evaluation may come from your number of repeat attendees. This number is especially helpful to verify if your association hosts several events throughout the year. Your members and stakeholders are always looking for value, so make sure there’s something for each of them even in your most niche events.
Takeaway: if you notice a healthy balance of new and repeat attendees, your event is on the right track. If they all belong to the same age range or have the same job title, however, you may need to tweak your offerings to provide more value for the other delegates you serve.
Compare the number of people that pick up their badge with the number of total registrants on file. Small differences are OK, but larger discrepancies need to be looked into to understand why you’re losing attendees.
For those delegates that are present, ensure you have a way to track where they’re checking in. This includes monitoring your event hashtag on social media to see what people are raving about and collecting participation data across all sessions. This should give you a great idea of what kinds of topics people are really looking to learn more about, discuss, and share.
Takeaway: Meeting planners are very busy onsite, but you need to put some time aside to get a holistic view of how people are living the event. Don’t underestimate the power of asking delegates directly about their experience if you want the most unfiltered answers to inform your event evaluation.
There are many ways to structure event satisfaction surveys. You most likely already have several burning questions you’d like to pose to delegates. But are your surveys suffering from low response rates?
Why not counter this by asking one very simple question off the bat: “On a scale of 1-10, how likely are you to recommend this event to a friend or colleague?”
This kind of question will provide you with what’s known as a Net Promoter Score. It’s currently being used by two-thirds of Fortune 1000 companies as a way to measure loyalty and can be correlated with revenue growth. It’s a great tool for event evaluation!
How it works:
Everyone that enters a score of 9 or 10 are called Promoters, while those who answer 0 through 6 are labeled Detractors.
Your score is calculated by subtracting the percentage of customers who are Detractors from the percentage of customers who are Promoters.
What about the 7s and 8s? They fall somewhere in between and simply count towards your total number of respondents.
A final score above 0 is considered good while achieving 50 or more means your event is firing on all cylinders! If you receive a negative score, a serious revamp is in order.
Takeaway: Add the NPS question into your survey invitation email so that any time-strapped respondents can still give you valuable feedback. We highly recommend adding an open-ended follow-up question to the NPS so you can glean some specifics regarding what can be improved.
Justin is passionate about bridging the gap between art and business, and is constantly on the lookout for great event marketing content to share with the sensov/ community.